Six player archetypes, twenty rosters, one data-driven framework
Author
Giannis Tsougkrianis
Published
June 28, 2026
Introduction
Every EuroLeague roster carries an offensive identity before a single possession tips off — a mix of shooters, finishers, and creators that determines what a team can and can’t do on a given night. Most of the time that identity gets described in scouting-report language: “three-and-D wing,” “stretch four,” “lead guard.” Useful shorthand, but built on eye-test labels that are inconsistent from team to team and analyst to analyst.
This piece takes a different approach. Using a statistical technique called non-negative matrix factorization (NMF) — applied to every EuroLeague rotation player’s shot selection, shot creation, and scoring-context tendencies this season — we let the data itself surface six recurring offensive “flavors,” then measured exactly how much of each flavor every player and every roster actually carries.
The Six Archetypes, in Plain Terms
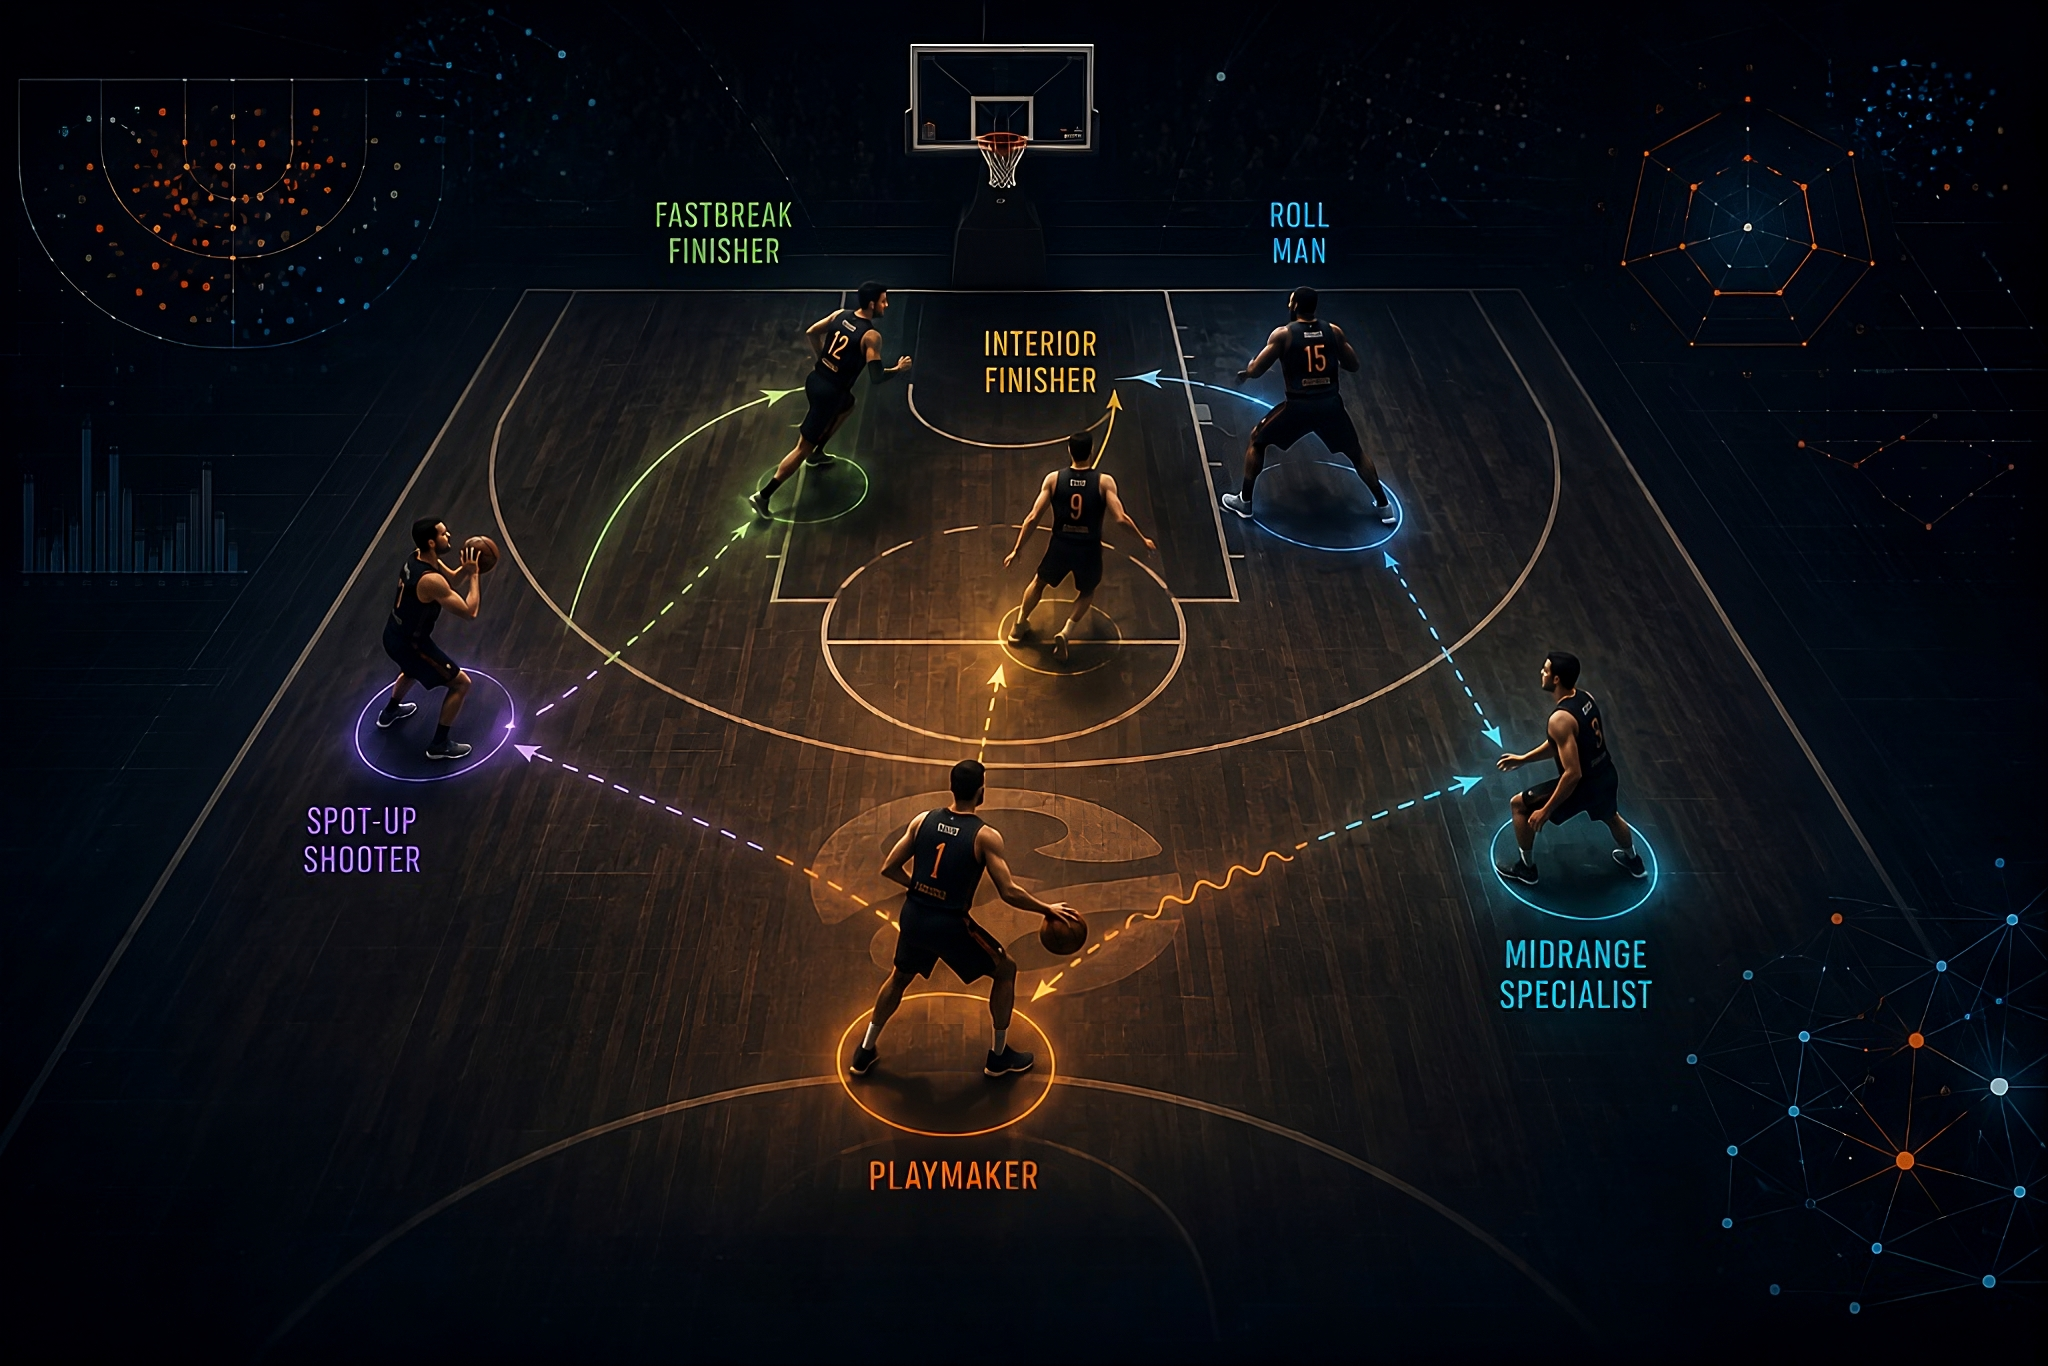
After testing cluster counts from three through ten, six emerged as the number that balanced statistical fit with basketball-interpretable groupings:
Midrange Specialist — built overwhelmingly around midrange shot share, with a secondary playmaking thread running through it.
Fastbreak Finisher — defined by scoring disproportionately in transition, with paint scoring close behind.
Roll Man — bigs who score almost entirely off shots someone else created for them — finishing rolls and lobs rather than generating their own look.
Spot-Up Shooter — high-volume catch-and-shoot three-point threats whose scoring leans on a teammate’s setup rather than their own shot creation.
Interior Finisher — players whose scoring is concentrated in the paint, outside of the fastbreak.
Playmaker — high-usage, high-assist shot creators who carry the heaviest offensive shot-creation load.
No player is purely one type. Each player gets a six-way mixture summing to 100% — and the archetype label you’ll see throughout combines every archetype where a player clears a 20% share, capturing genuine hybrids rather than forcing everyone into one box.
Part I — The League’s Offensive Fingerprint
What Type of Player Is Most Common?
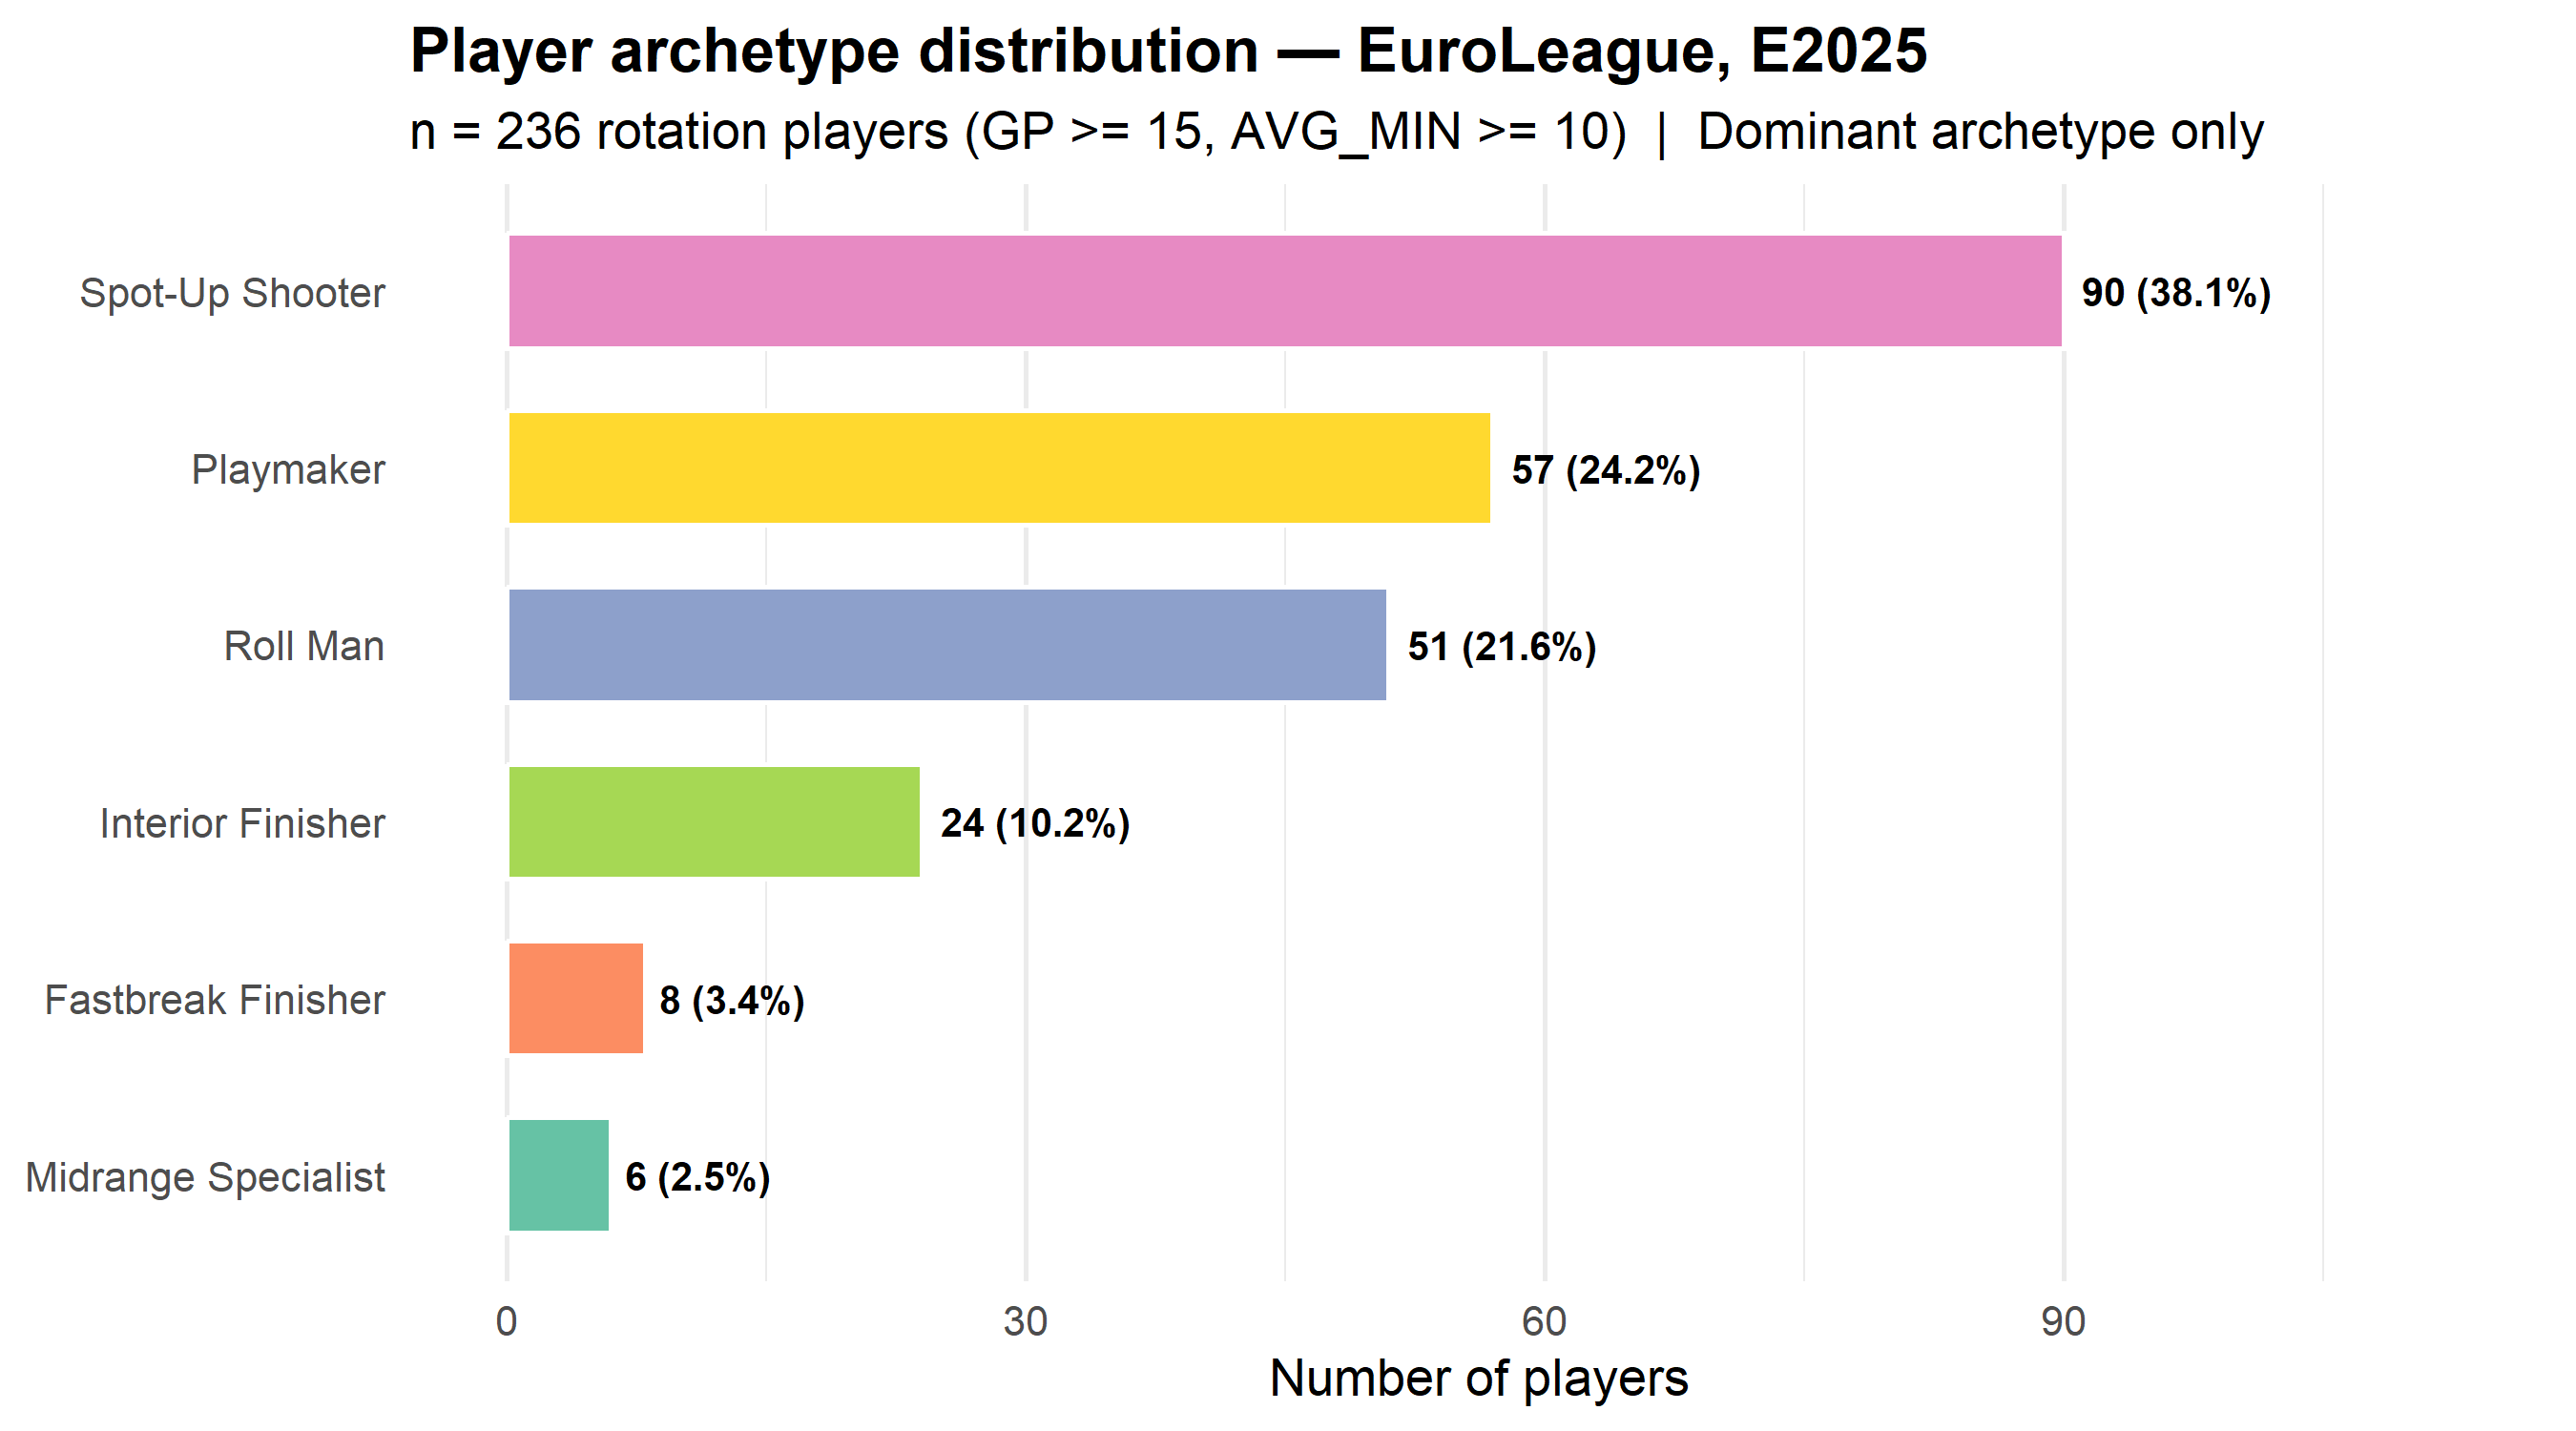
Spot-Up Shooter is, by a wide margin, the league’s most common offensive identity — 38.1% of rotation players, more than the next two archetypes combined. Playmaker (24.2%) and Roll Man (21.6%) split most of the remainder, while genuine Midrange Specialists (2.5%) and Fastbreak Finishers (3.4%) are nearly extinct as primary identities. The modern EuroLeague offense, at least by dominant labels, is built on floor-spacing shooters first.
Almost nobody is “just one thing.” Of 236 rotation players, 180 (76.3%) carry a second archetype at or above the 20% threshold. A single dominant label is real, but it’s rarely the whole story.
Primary vs. Secondary: Where the Real Skill Hides
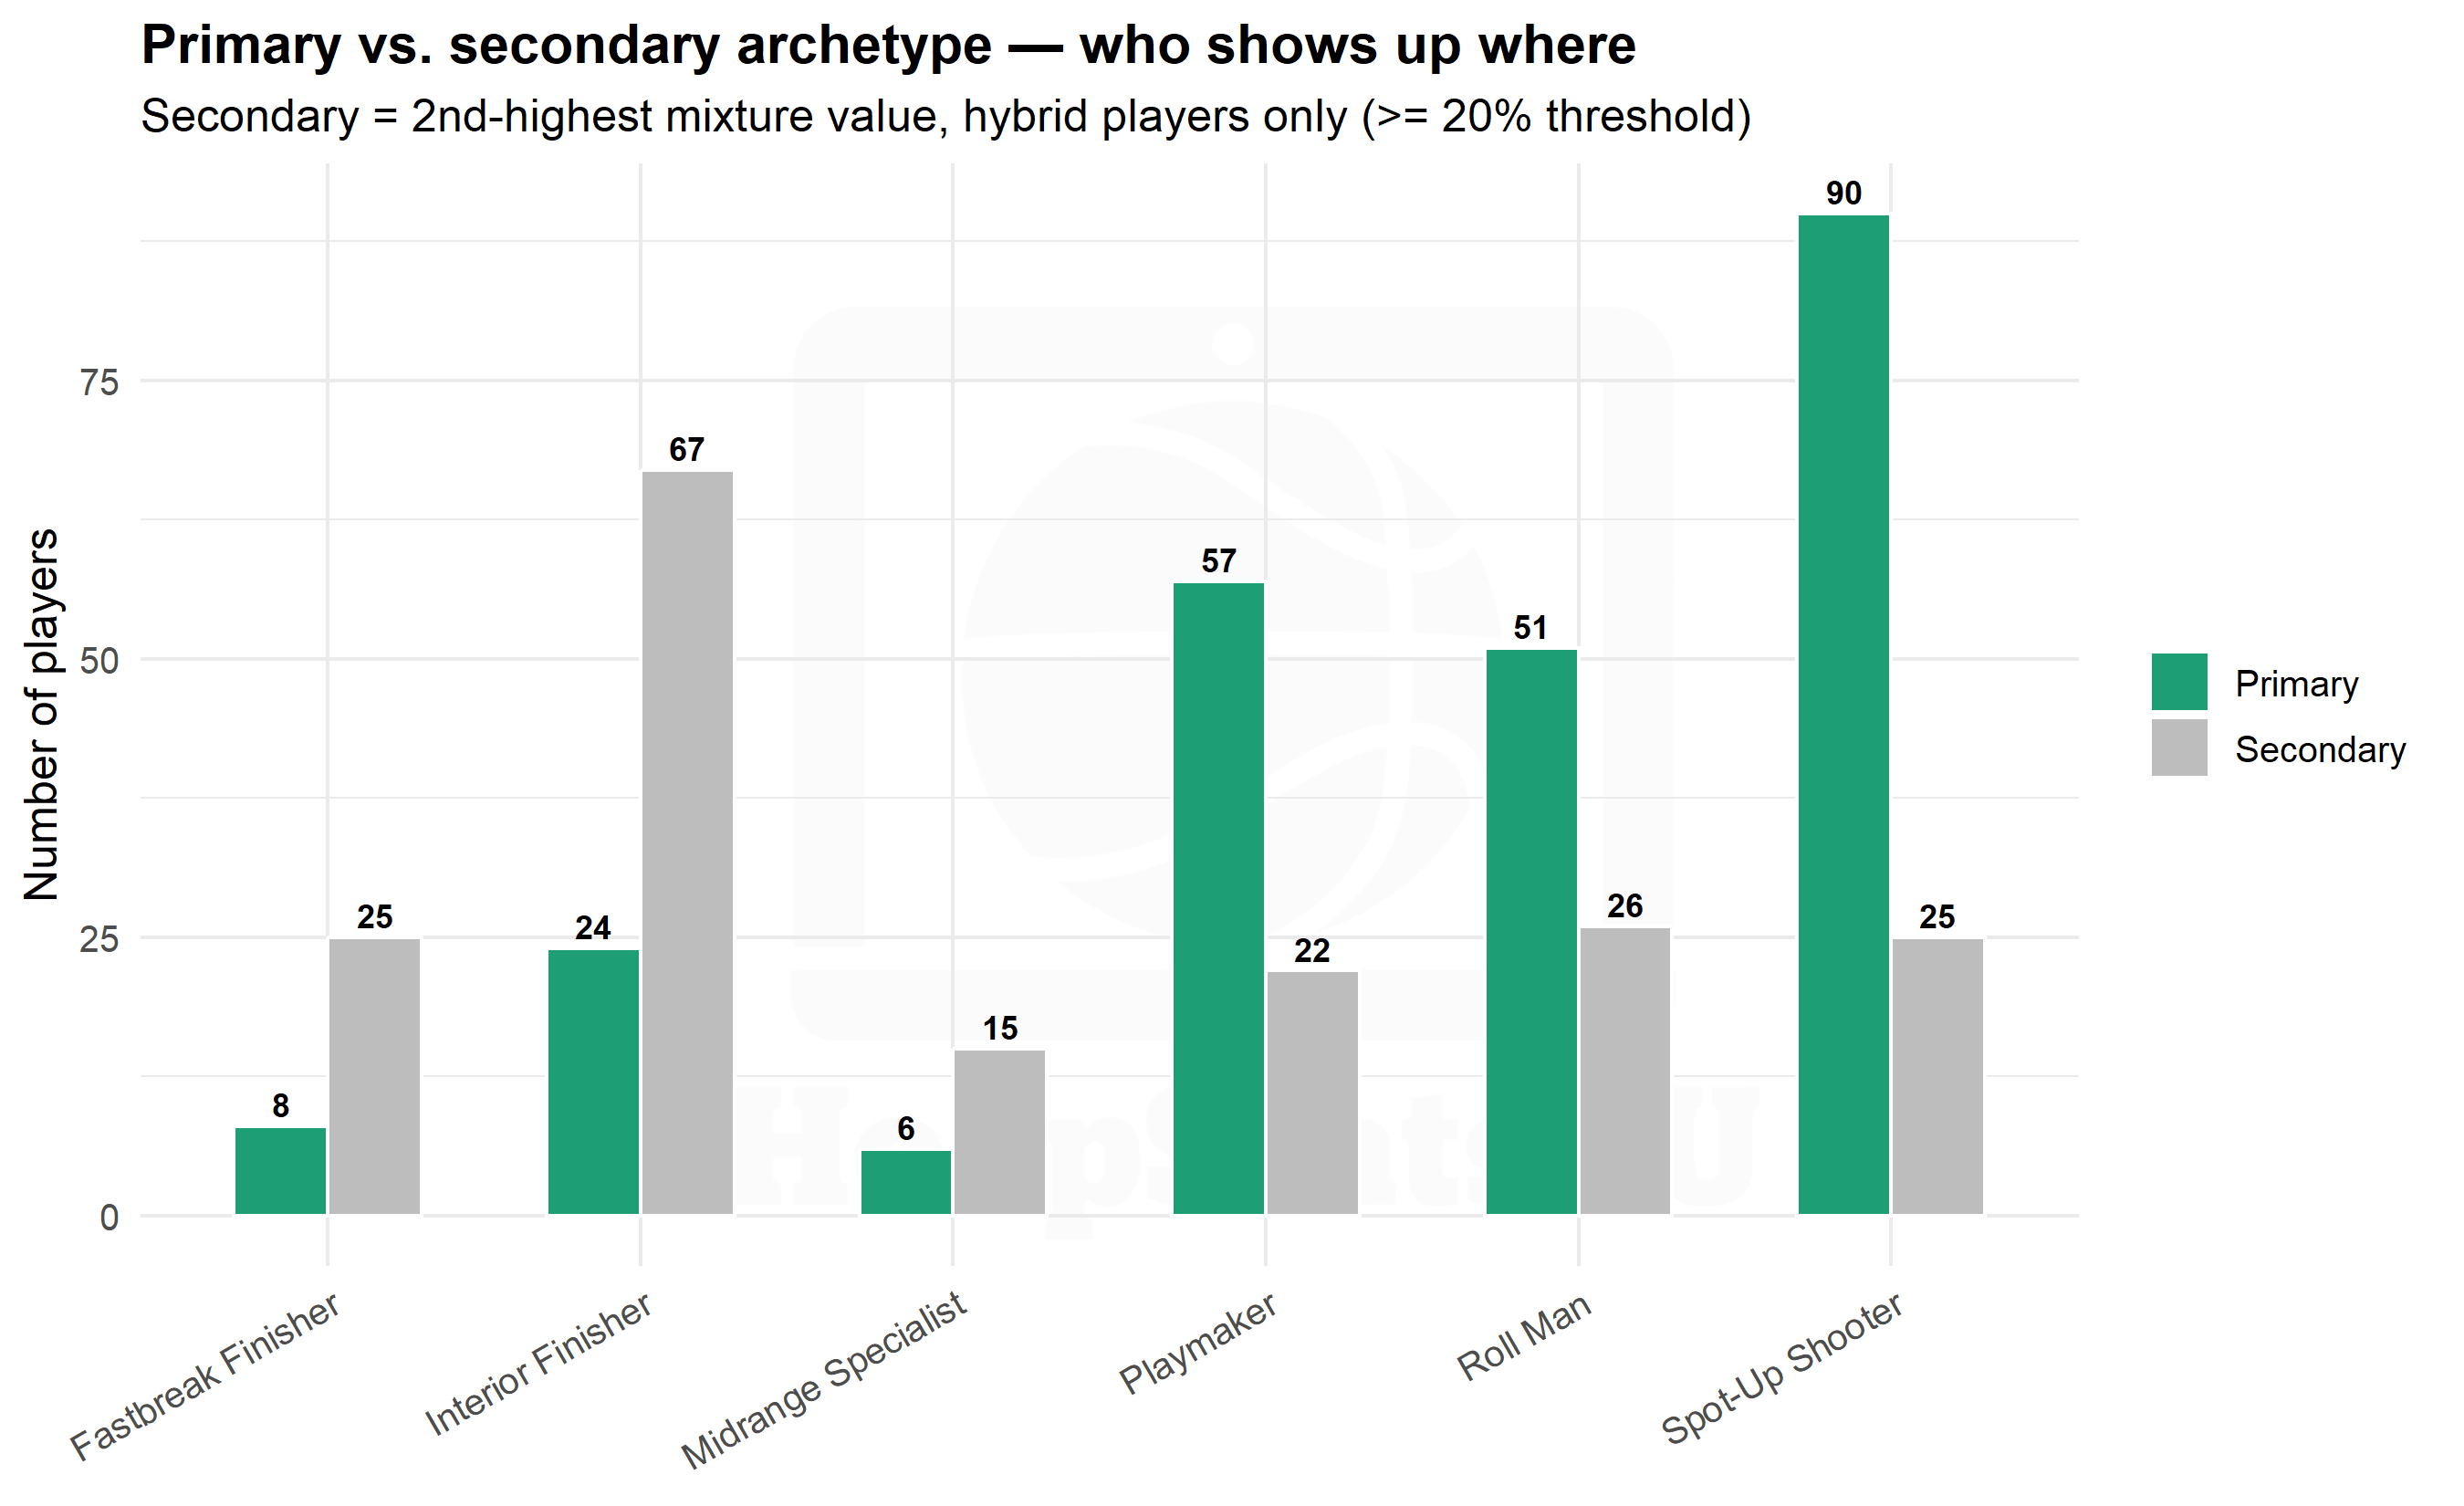
This is where the dominant-archetype chart hides something important. Interior Finisher is one of the rarest primary identities in the league (10.2% of players) — but it’s the single most common secondary skill, present in 37.2% of all hybrid profiles. A large share of EuroLeague wings and forwards aren’t full-time interior scorers, but they all have some real ability to finish inside when the play calls for it. The archetype that looks scarce at the surface is actually one of the most widely distributed skills in the league — just rarely anyone’s headline trait.
For Each Primary Type, What Usually Comes Second
The chart above shows which archetypes tend to show up as anyone’s secondary skill, league-wide. A sharper question: if you know a player’s primary archetype, what’s the secondary skill most likely to accompany it specifically? This cut includes every player — not just the hybrids above the 20% threshold — since even a “pure” specialist’s mathematically second-best skill is informative about their overall shape, even at a small percentage.
For Each Primary Archetype, the Most Common Secondary Skill
Primary archetype
Most common secondary
Players
% of that primary group
Midrange Specialist
Playmaker
3
50%
Fastbreak Finisher
Roll Man
3
37.5%
Roll Man
Interior Finisher
36
70.6%
Spot-Up Shooter
Roll Man
30
33.3%
Interior Finisher
Spot-Up Shooter
10
41.7%
Playmaker
Interior Finisher
28
49.1%
The table above is the headline answer. For the full breakdown — useful if a primary type’s secondary skills are split fairly evenly rather than dominated by one — here’s every combination:
Full Primary × Secondary Archetype Cross-Tab — Rows: dominant archetype. Columns: 2nd-highest mixture archetype. All 236 players included.
dominant_label
Midrange Specialist
Fastbreak Finisher
Roll Man
Spot-Up Shooter
Interior Finisher
Playmaker
Midrange Specialist
0
0
1
1
1
3
Fastbreak Finisher
0
0
3
1
2
2
Roll Man
3
3
0
7
36
2
Spot-Up Shooter
7
24
30
0
15
14
Interior Finisher
2
2
1
10
0
9
Playmaker
8
5
2
14
28
0
Part II — Team Composition: Who’s Building What
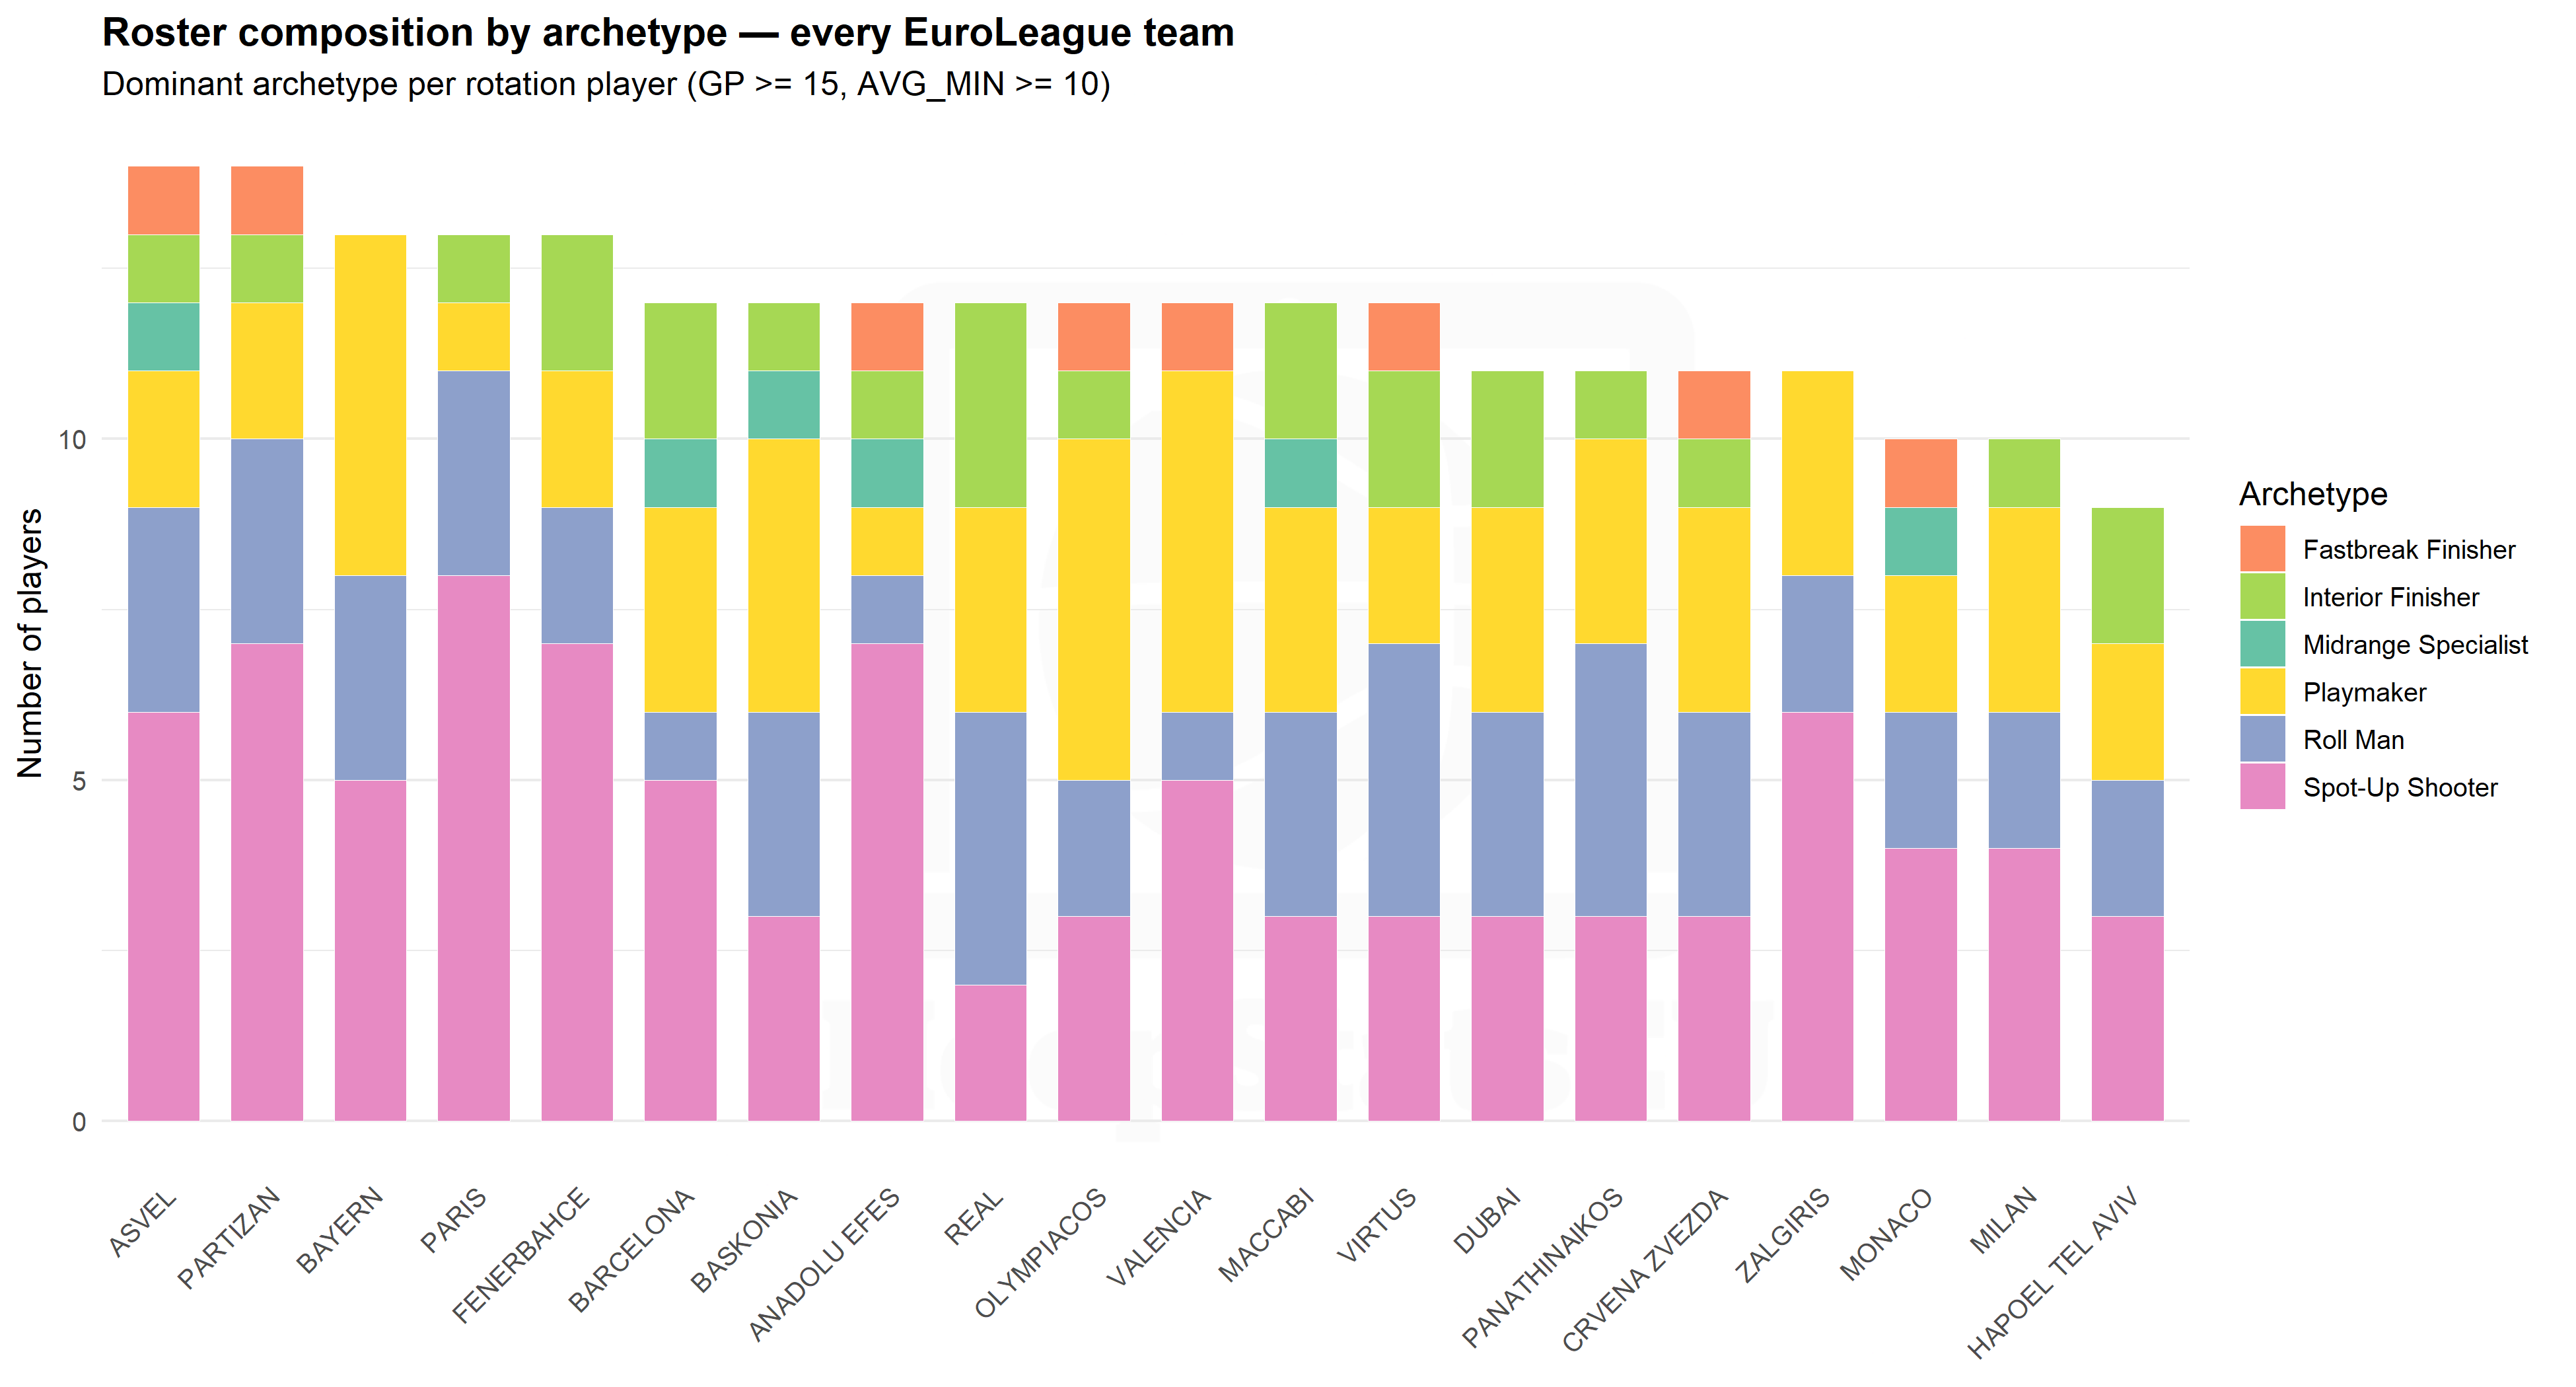
Roster Composition by Dominant Archetype
Which Teams Lean Hardest Into Each Type
Top 3 Teams by Dominant-Archetype Headcount
Primary archetype
Team
Players
Fastbreak Finisher
ASVEL
1
ANADOLU EFES
1
MONACO
1
Interior Finisher
REAL
3
BARCELONA
2
DUBAI
2
Midrange Specialist
ASVEL
1
BARCELONA
1
BASKONIA
1
Playmaker
BAYERN
5
OLYMPIACOS
5
VALENCIA
5
Roll Man
REAL
4
PANATHINAIKOS
4
VIRTUS
4
Spot-Up Shooter
PARIS
8
ANADOLU EFES
7
PARTIZAN
7
Three categories produce flat-out ties at the top: Bayern Munich, Olympiacos, and Valencia all carry exactly five Playmaker-dominant players; Real Madrid, Panathinaikos, and Virtus Bologna all run four Roll-Man-dominant bigs. Spot-Up Shooter is the only category with real separation — Paris Basketball’s eight pure shooters clear the next-best teams (Anadolu Efes and Partizan, seven apiece) by a full player. At the rare end, Fastbreak Finisher and Midrange Specialist are so scarce that “leading the league” means having exactly one specialist — a depth story as much as a strength one.
Secondary-Skill Depth, Team by Team
Top 3 Teams by Secondary-Skill Depth
Secondary archetype
Team
Players
Fastbreak Finisher
FENERBAHCE
4
BASKONIA
3
VALENCIA
3
Interior Finisher
OLYMPIACOS
6
DUBAI
5
BAYERN
5
Midrange Specialist
HAPOEL TEL AVIV
3
ASVEL
2
MILAN
2
Playmaker
PARTIZAN
3
FENERBAHCE
3
ASVEL
2
Roll Man
BARCELONA
3
ANADOLU EFES
3
ASVEL
2
Spot-Up Shooter
REAL
4
MACCABI
4
BASKONIA
3
Olympiacos stands out here — six players carrying Interior Finisher as a real secondary skill, the deepest such bench in the league. Fenerbahçe shows up twice (Fastbreak Finisher and Playmaker secondary depth), suggesting a roster built with more positional overlap than most.
Part III — Beyond Headcounts: The Full Mixture
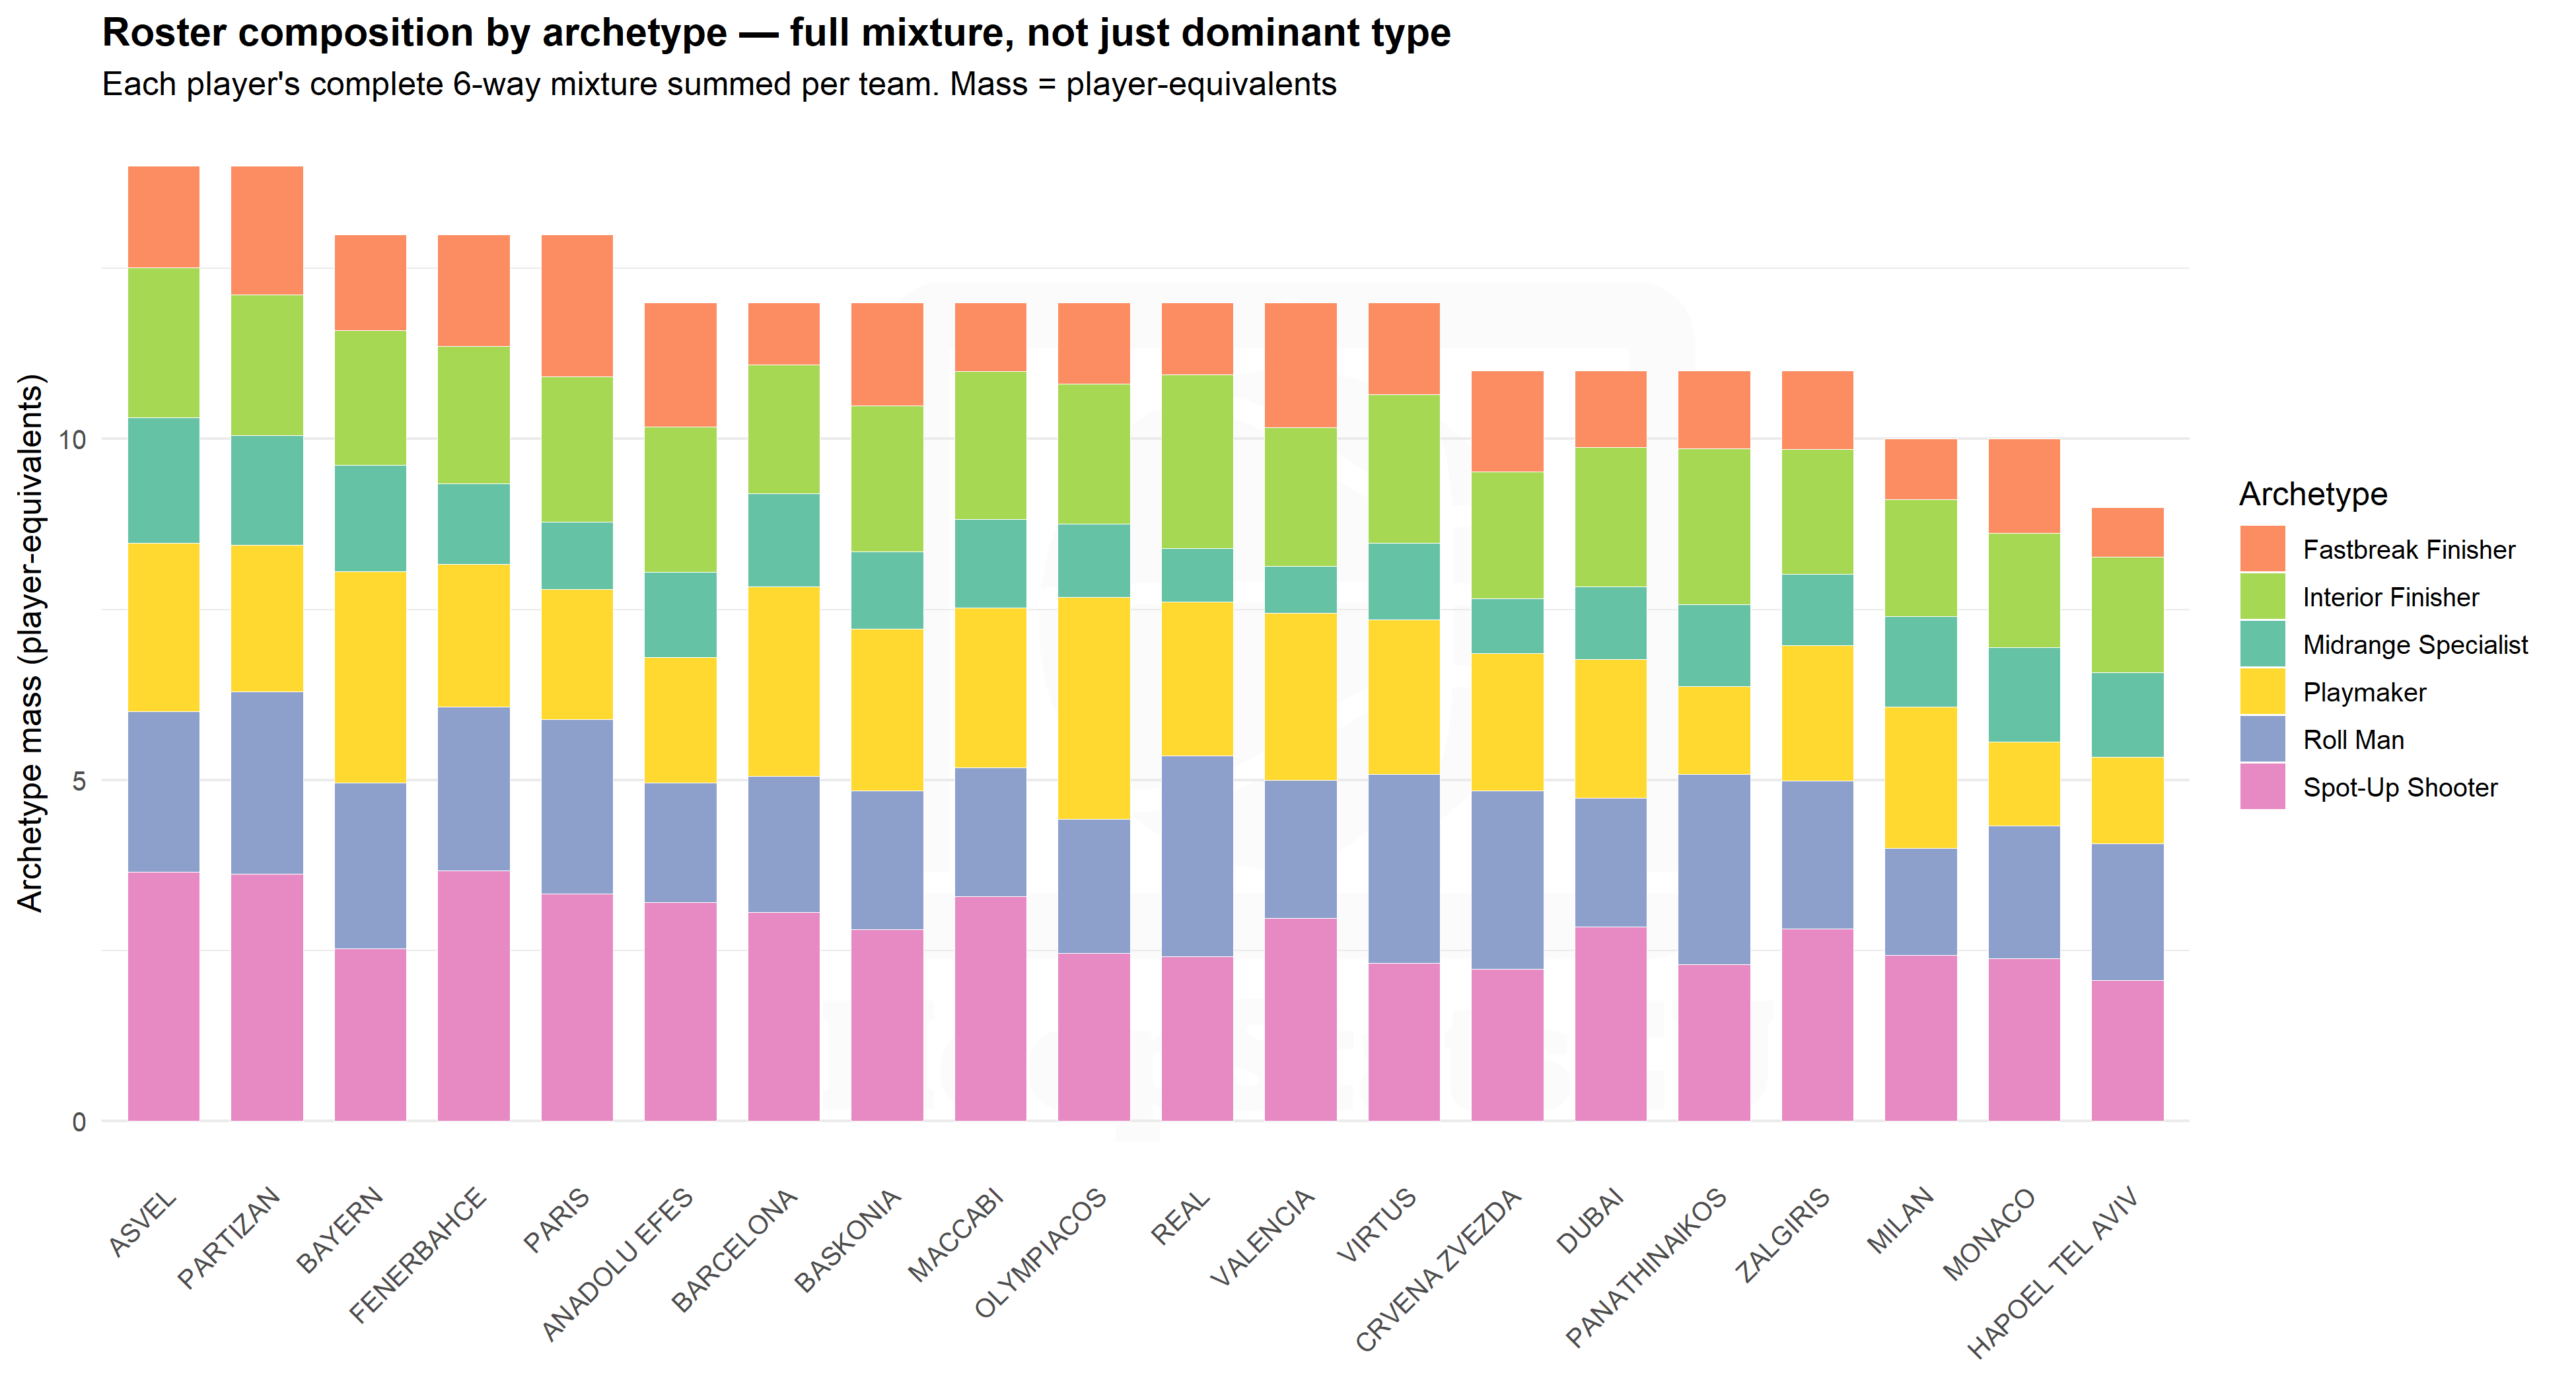
Headcounts answer “how many specialists.” They don’t capture the players sitting just under the 20% labeling threshold, or a team that’s quietly stacked five players each carrying 25% of a skill instead of one player carrying 100% of it. For that, every player’s complete six-way mixture gets summed across the roster — what we’re calling archetype mass, measured in player-equivalents.
Archetype Mass — Player-Equivalents Across the Roster
Top 3 Teams by Raw Archetype Mass
Archetype
Team
Mass
Fastbreak Finisher
PARIS
2.09
PARTIZAN
1.88
VALENCIA
1.83
Interior Finisher
REAL
2.55
PANATHINAIKOS
2.29
ASVEL
2.20
Midrange Specialist
ASVEL
1.83
PARTIZAN
1.60
BAYERN
1.56
Playmaker
OLYMPIACOS
3.25
BAYERN
3.10
BARCELONA
2.78
Roll Man
REAL
2.94
PANATHINAIKOS
2.79
VIRTUS
2.77
Spot-Up Shooter
FENERBAHCE
3.67
ASVEL
3.65
PARTIZAN
3.62
Why raw mass alone can mislead. Mass is a sum across every eligible rotation player — which means a team with a deeper qualifying roster starts every category with a structural head start, independent of actual style. ASVEL ties for the league’s largest eligible roster at 14 players, and shows up in three separate top-3 lists above (Interior Finisher, Midrange Specialist, Spot-Up Shooter). Some of that is genuine roster construction — but some of it may simply be “more players, more mass everywhere.” The table below controls for that.
Normalizing for Roster Size — Share of the Skill Budget
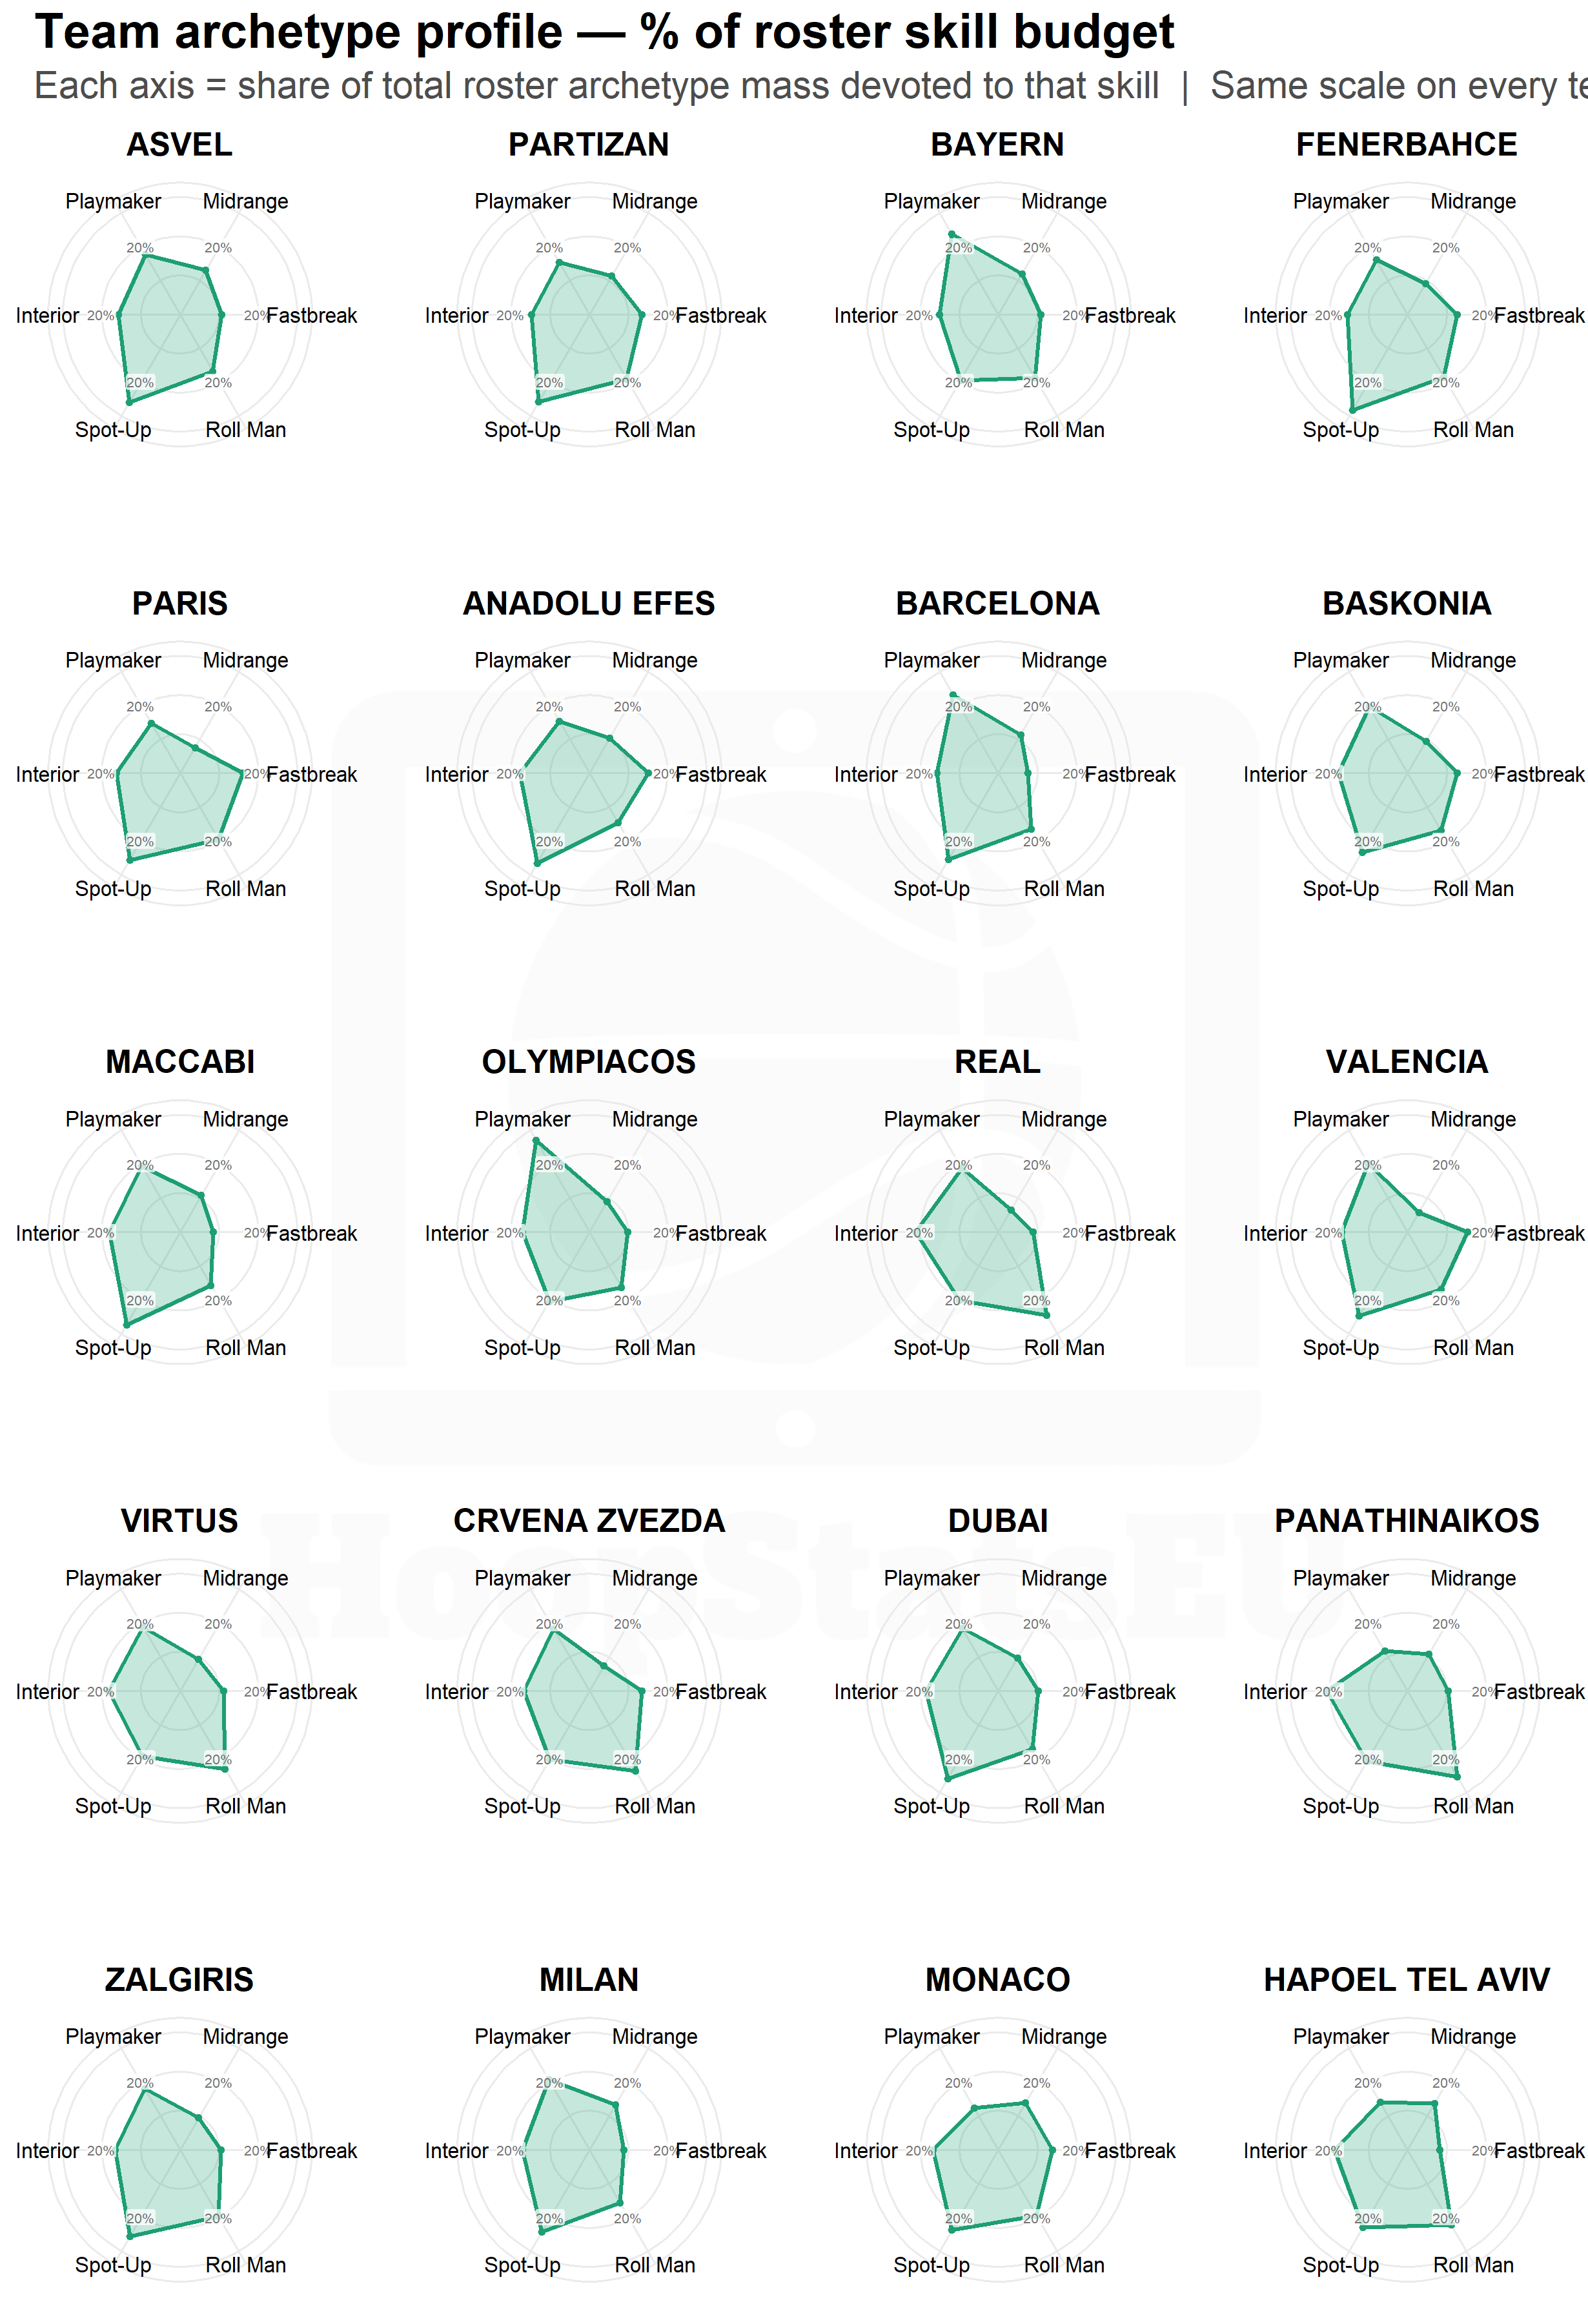
Every player’s mixture sums to 100%, so a team’s total mass across all six archetypes always equals its eligible roster size exactly. Dividing each archetype’s mass by that total converts raw player-equivalents into a percentage share of the roster’s skill budget — directly comparable across teams regardless of rotation depth.
Top 3 Teams by Normalized Archetype Share
Archetype
Team
Share of roster
Fastbreak Finisher
PARIS
16.1%
VALENCIA
15.2%
ANADOLU EFES
15.2%
Interior Finisher
REAL
21.2%
PANATHINAIKOS
20.8%
HAPOEL TEL AVIV
18.8%
Midrange Specialist
MONACO
13.8%
HAPOEL TEL AVIV
13.7%
MILAN
13.3%
Playmaker
OLYMPIACOS
27.1%
BAYERN
23.8%
BARCELONA
23.1%
Roll Man
PANATHINAIKOS
25.4%
REAL
24.5%
CRVENA ZVEZDA
23.7%
Spot-Up Shooter
FENERBAHCE
28.2%
MACCABI
27.4%
ANADOLU EFES
26.7%
Compare this table against the raw-mass version above — any team that disappears from one list and not the other is the roster-size effect in action; any team that holds its position in both is carrying a genuine, depth-independent specialization.
Part IV — Visualizing the Shape: Radar Profiles
A bar chart tells you “how much” of each archetype a team carries. A radar tells you the shape of that — at a glance, whether a roster is balanced across all six skills or concentrated in two or three.
Every Team’s Archetype Fingerprint
Compare Any Two Teams
Use the two dropdowns above the chart to pick any two teams to compare directly — each one updates independently.
Compare Any Two Players
Same idea, one level down — pick any two rotation players in the league and see their archetype mixtures overlaid directly.
Closing Thoughts
Six archetypes, twenty rosters, and a clear pattern emerges: the EuroLeague’s offensive backbone is shooting and shot creation — Spot-Up Shooter and Playmaker together account for nearly two-thirds of every primary identity in the league — while true specialists in fastbreak or midrange scoring have all but disappeared as standalone profiles. What separates rosters isn’t really whether they have shooters, but how that shooting gets distributed: concentrated in two or three names, or spread thin across the whole rotation.
This archetype layer is also a foundation, not an endpoint. The next natural step is pairing it with what we already know about how teams actually move the ball — testing whether the archetype mixtures that look complementary on a radar chart translate into the lineup combinations that actually win minutes on the floor.
Methodology note: Archetypes are derived via non-negative matrix factorization (NMF, rank = 6, “brunet” algorithm) on rescaled per-game offensive rate stats — scoring efficiency, assist and turnover rates, three-point reliance, assisted-shot percentage, offensive rebounding, shot-zone shares, and transition/second-chance scoring shares — for every player meeting a minimum of 15 games played and 10 minutes per game in E2025. A player’s archetype mixture sums to 100% across all six types; the archetype label combines every type at or above a 20% share. Team-level figures aggregate every eligible rotation player’s full mixture — not just their dominant label — into a roster-wide “mass,” normalized to a percentage share of the team’s total mass for cross-team comparability.